
World Bank says extreme poverty fell to 2.6%
How poor is India today? The World Bank’s new report says extreme poverty fell from 27.1% in 2011 to just 2.6% in 2023, one of the fastest falls in the world. But wage gaps are wide, youth unemployment is rising and most of the remaining poor live in a few eastern States. Read it to revise poverty lines and the Multidimensional Poverty Index.
- Extreme poverty
- 27.1% (2011) to 2.6% (2023)
- Line
- Under $3.00 a day
- At $4.2 a day
- 57.7% to 16.1%
- People lifted
- About 496 million
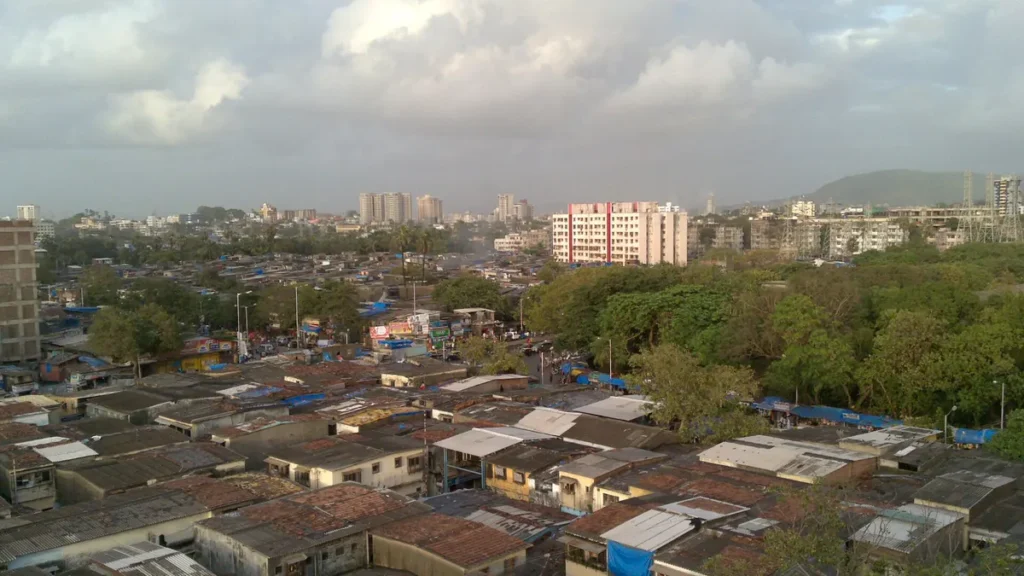
The fall in poverty: what happened?
Poverty numbers decide who gets free grain, housing and cash support. So when a big global body says poverty has fallen sharply, it shapes both policy and debate.
- The World Bank released its Poverty and Equity Brief for India on Friday.
- Extreme poverty, meaning people living on under $3.00 a day, fell from 27.1% in 2011 to 2.6% in 2023.
- At a wider line of $4.2 a day, poverty fell from 57.7% to 16.1%, lifting about 496 million people out.
- The Multidimensional Poverty Index fell from 53.8% (2005-06) to 16.4% (2019-21). The World Bank’s own measure was 15.5% in 2022-23.
- But the report flags wide wage gaps and rising youth unemployment. Most of the remaining poor live in a belt from Uttar Pradesh to West Bengal.
How is poverty measured?
Income poverty uses a money line. The World Bank’s international lines are in dollars at purchasing power parity (PPP), which adjusts for what money can buy in each country. Its extreme poverty line is now $3.00 a day.
India’s own poverty lines came from expert groups such as the Tendulkar Committee (2009) and the Rangarajan Committee (2014). India has not set an official new line since then.
Multidimensional poverty looks beyond income, at health, education and living standards such as cooking fuel, toilets, housing and electricity.
The global Multidimensional Poverty Index is made by the Oxford Poverty and Human Development Initiative and the United Nations Development Programme. NITI Aayog makes a national version.
How has poverty changed?
| Measure | Earlier | Latest |
|---|---|---|
| Extreme poverty ($3.00 a day) | 27.1% (2011) | 2.6% (2023) |
| Poverty at $4.2 a day | 57.7% (2011) | 16.1% (2023) |
| Multidimensional Poverty Index | 53.8% (2005-06) | 16.4% (2019-21) |
Which laws and Articles apply?
- Article 38: the State shall reduce inequalities in income and status (Directive Principle).
- Article 39(b) and (c): fair sharing of resources and no concentration of wealth.
- National Food Security Act, 2013: subsidised grain for about two-thirds of people.
- Article 21: the right to life includes the right to live with dignity.
Why does the fall in poverty matter?
| Angle | What to note |
|---|---|
| Welfare targeting | Poverty data decides who gets help. |
| Growth story | Shows fast progress since 2011. |
| Job quality | Low-paid work limits real gains. |
| Regional gaps | Poverty is concentrated in eastern States. |
What are the problems with the fall in poverty?
- Most new jobs are low-paid, so earnings have not risen much.
- Youth unemployment is rising.
- The gap between top and bottom earners is wide.
- India has no official, updated national poverty line.
What should be done next on the fall in poverty?
- Create more factory and service jobs that pay well.
- Match skills with what industry needs.
- Invest more in the poorer eastern States.
- Set a new official poverty line using fresh survey data.
What can Prelims ask on the fall in poverty?
Prelims probability: Expect a question on the Multidimensional Poverty Index: made by Oxford University and the United Nations Development Programme; covers health, education and living standards.
- World Bank extreme poverty line: $3.00 a day (PPP).
- India: 27.1% (2011) to 2.6% (2023) in extreme poverty.
- Global Multidimensional Poverty Index: Oxford Poverty and Human Development Initiative and UNDP.
- MPI covers health, education and living standards.
- Earlier Indian lines: Tendulkar (2009), Rangarajan (2014).
How to write about the fall in poverty in Mains
Practice question (15 marks, 250 words): India’s poverty has fallen sharply, yet job quality and regional gaps remain a concern. Discuss in the light of the World Bank’s latest assessment.
- Intro: 27.1% to 2.6% extreme poverty; 496 million lifted at $4.2.
- Drivers: consumption, jobs, welfare transfers, basic services.
- Concerns: low-paid jobs, youth unemployment, inequality, eastern belt.
- Way forward: good jobs, skills, eastern investment, new poverty line.
- Conclusion: from ending extreme poverty to building good livelihoods.
Ready lines for your answer
- India has won a big battle against extreme poverty.
- The next battle is for good jobs.
Quotable data pointPoverty at $4.2 a day fell from 57.7% to 16.1%, lifting about 496 million people.
Photo: Mark Hillary, CC BY 2.0, via Wikimedia Commons
Exam angle
Prelims: poverty lines, MPI makers and dimensions. · Mains GS-III: poverty, employment, inclusive growth.
Practice MCQs
Original practice questions (not PYQs).
The global Multidimensional Poverty Index is prepared by the Oxford Poverty and Human Development Initiative and:
Answer (c) & explanation
It is prepared by the Oxford Poverty and Human Development Initiative and the United Nations Development Programme. It measures health, education and living standards.
With reference to poverty estimation in India, which committee recommended a poverty line in 2014?
Answer (b) & explanation
The Rangarajan Committee reported in 2014. The Tendulkar Committee reported in 2009.
Questions students ask about this
What does the World Bank say about India's extreme poverty?
It fell from 27.1% in 2011 to 2.6% in 2023, using the $3.00-a-day line.
What is the Multidimensional Poverty Index?
A measure of poverty that looks at health, education and living standards, not just income.
Who prepares the global Multidimensional Poverty Index?
The Oxford Poverty and Human Development Initiative and the United Nations Development Programme.
Where do most of India's remaining poor live?
In a belt of States from Uttar Pradesh to West Bengal.