
GDP for UPSC: Meaning, Methods, GDP vs GVA vs GNP, Nominal vs Real, Base Year and Criticisms (Notes + PYQs)
UPSC has already asked about this. Read the story with these questions in mind.
Background: why we measure output
Gross Domestic Product is the market value of all final goods and services produced within a country’s borders in a given period, usually a year or a quarter. It became the standard measure of economic activity after the Great Depression and the Second World War, when economists such as Simon Kuznets and Richard Stone built national accounts to help governments plan. Today GDP guides budgets, tax devolution, interest rates and investment decisions. The Finance Commission uses income measures in its formula, the RBI looks at growth while setting rates, and fiscal deficit targets are stated as a share of GDP. In India the National Statistical Office in the Ministry of Statistics and Programme Implementation compiles GDP following the UN System of National Accounts. Understanding how it is measured, and what it leaves out, is basic to the economy paper.
Three ways to measure
- Production (value added): output minus intermediate consumption in each sector.
- Income: wages + rent + interest + profits + mixed income.
- Expenditure: C + I + G + (X – M).
In theory all three give the same number; in practice statistical discrepancies remain.
- 1Gross value added at basic prices
- 2+ net product taxes = GDP at market prices
- 3+ net factor income from abroad = GNP
- 4– depreciation = NNP at market prices
- 5– net indirect taxes = National income
GDP, GVA, GNP, NNP
| Measure | How it is derived |
|---|---|
| GVA at basic prices | Output – intermediate consumption + production taxes – production subsidies |
| GDP at market prices | GVA + product taxes – product subsidies |
| GNP | GDP + net factor income from abroad |
| NNP | GNP – depreciation (consumption of fixed capital) |
| National income | NNP at factor cost |
Nominal, real and the deflator
Nominal GDP uses current prices; real GDP uses base-year prices. GDP deflator = nominal GDP ÷ real GDP × 100. It covers all goods and services, unlike CPI or WPI, so it is the broadest price index, though it is released only with GDP data.
- ProductionSum of value added by sectors
- IncomeWages + rent + interest + profit
- ExpenditureC + I + G + (X – M)
- CheckStatistical discrepancy reconciles
Base year
India moved to base year 2011-12 in 2015, adopting GVA and using the MCA-21 corporate database. MoSPI released a new series with base year 2022-23 on 27 February 2026, replacing the 2011-12 series. Base revisions capture new sectors and better data.
Key terms in one table
| Term | Formula | Meaning |
|---|---|---|
| GVA at basic prices | Output minus intermediate consumption, plus production taxes, minus production subsidies | Value added by each sector |
| GDP at market prices | GVA + product taxes – product subsidies | Total output as bought in the market |
| GNP | GDP + net factor income from abroad | Output of a country’s residents |
| NNP | GNP – depreciation | Net output after wear and tear |
| National income (NNP at factor cost) | NNP at market prices – net indirect taxes | Income earned by factors of production |
| GDP deflator | Nominal GDP / Real GDP x 100 | Broadest price index |
What GDP does not show
Distribution of income, unpaid household work (largely by women), environmental damage, informal sector activity measured indirectly, and well-being. Alternatives: HDI, Green GDP, the World Happiness Report, and the Multidimensional Poverty Index.
Final vs intermediate goods
GDP counts only final goods and services to avoid double counting. Wheat bought by a household is final, but wheat bought by a baker to make bread is intermediate, because its value is already included in the price of bread. The value-added method solves this by adding the extra value created at each stage: the farmer’s wheat, the miller’s flour, the baker’s bread. Some items are left out by design. Second-hand goods are excluded because they were counted when first produced, though the dealer’s commission counts. Transfer payments such as pensions and scholarships are excluded because no output is produced in return. Purely financial transactions like buying shares are excluded, but the broker’s fee is included. Unpaid household work is excluded, even though it has economic value.
GDP and welfare
| Measure | What it adds | Who publishes |
|---|---|---|
| Per capita income | Average income per person | NSO; State statistical bureaus |
| Human Development Index | Health, education and income | UNDP |
| Multidimensional Poverty Index | Deprivations in health, education, living standards | UNDP-OPHI; NITI Aayog national MPI |
| Green GDP | Deducts depletion of natural resources and pollution | Experimental estimates |
| Gross National Happiness | Wellbeing, culture, governance, environment | Bhutan |
GDP can rise while inequality widens, forests disappear or rivers are polluted. That is why welfare measures complement it rather than replace it.
Quarterly and advance estimates
Indian GDP is released in stages. First advance estimates come in early January for the year ending in March, so the Union Budget can use them. Second advance estimates follow at the end of February, along with the third quarter figures. Provisional estimates come at the end of May, and then first, second and third revised estimates follow in later years as more complete data on companies, government spending and agriculture arrives. Quarterly estimates are released about two months after each quarter ends. This is why growth numbers for a year can be revised up or down, sometimes noticeably, and why analysts look at several indicators such as the Index of Industrial Production, GST collections, electricity demand and PMI surveys to judge the economy in real time.
Prelims traps on GDP
Remember that GDP is territorial while GNP is based on residents. A foreign company’s output in India is in India’s GDP. Remittances by Indians abroad affect GNP, not GDP. When nominal GDP growth is lower than real growth, it means the deflator has fallen, that is, prices declined overall. India’s GVA is reported at basic prices, a change made in the 2015 revision.
Gdp: UPSC angle
For UPSC CSE
Prelims: GDP vs GNP vs NNP, factor cost vs market price, deflator. Mains GS-III: growth vs development; data quality debates.
Gdp UPSC PYQs (Prelims)
Questions UPSC has actually asked, from the official papers. Pick an option to check yourself.
The national income of a country for a given period is equal to the
National income is measured as the money value of all final goods and services produced in a year. Only final goods count, to avoid double counting. Consumption plus investment leaves out government spending and net exports. Answer as per the official UPSC key · Battle IAS PYQ bankAnswer (d) & why
With reference to Indian economy, consider the following statements :
– 1. The rate of growth of Real Gross Domestic Product has steadily increased in the last decade.
– 2. The Gross Domestic Product at market prices (in rupees) has steadily increased in the last decade.
Which of the statements given above is/are correct?
The real GDP growth rate went up and down between 2005 and 2015, dipping in 2008-09 and again in 2012-13. Nominal GDP at market prices in rupees rose every year, because of both real growth and inflation. A level can rise steadily even when its growth rate does not. Answer as per the official UPSC key · Battle IAS PYQ bankAnswer (b) & why
In the context of Indian economy, consider the following statements :
– 1. The growth rate of GDP has steadily increased in the last five years.
– 2. The growth rate in per capita income has steadily increased in the last five years.
Which of the statements given above is/are correct ?
Between 2006-07 and 2010-11, India’s GDP growth went up and down: about 9.6% and 9.3%, then a dip to about 6.7% in 2008-09 after the global crisis, then a recovery. Per capita income growth followed the same ups and downs, so neither rose steadily. Answer as per the official UPSC key · Battle IAS PYQ bankAnswer (d) & why
Mains PYQs on this topic
No UPSC Mains question from 2023-2026 is directly on this topic. Older papers (2013-2022) will be added as the Mains bank grows.
Quick quiz
GDP at market prices = GVA at basic prices +
Product taxes minus product subsidies.Answer (b)
NNP is derived from GNP by subtracting
Consumption of fixed capital.Answer (b)
The GDP deflator is
Broadest price index.Answer (a)
FAQs
Who calculates GDP in India?
The National Statistics Office under MoSPI.
What is the difference between GDP and GNP?
GNP adds net factor income from abroad to GDP.
What is the current base year?
2022-23. MoSPI released the new series on 27 February 2026, replacing the 2011-12 base.
Why is real GDP more useful than nominal GDP?
It shows actual change in output by removing price effects.
Is GNP always greater than GDP for India?
No. India’s net factor income from abroad is usually negative, because foreigners earn more in India from investment than Indians earn abroad, so GNP is slightly lower than GDP.
What is the GDP deflator?
The ratio of nominal to real GDP, multiplied by 100. It covers all goods and services in GDP, unlike CPI or WPI.
Why are GDP figures revised?
Early estimates rely on partial data. As full data on companies, agriculture and government comes in, later estimates replace them.
Spotted an error? Tell us. We correct within 48 hours.
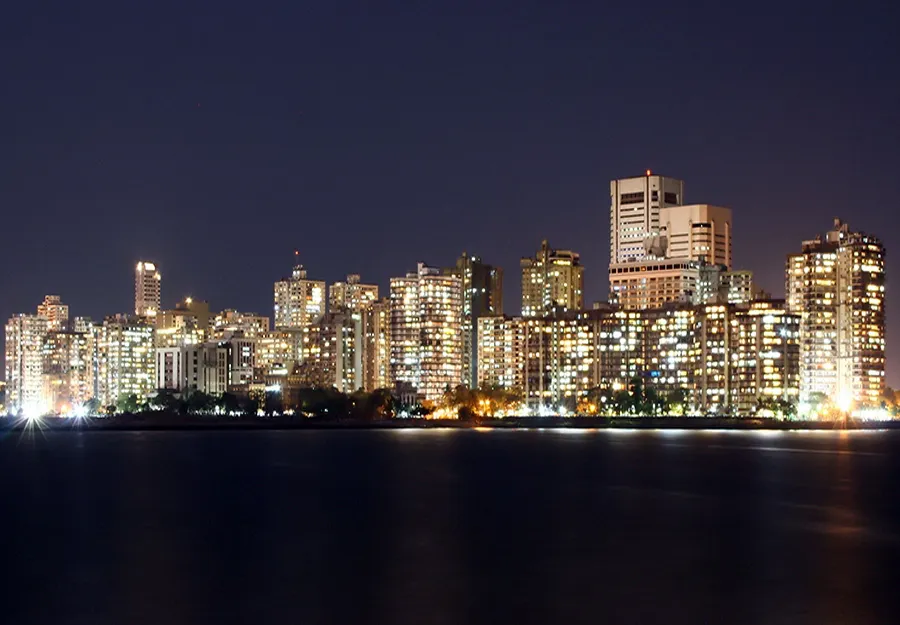
Image: Jasvipul Chawla, Wikimedia Commons, CC BY-SA 2.0
How to use this in Mains
If asked: GDP does not measure well-being. Discuss. (GS-III)
Quote: “Distribution of income, unpaid household work (largely by women), environmental damage, informal sector activity measured indirectly, and well-being.”
Use it: Your core list of what GDP misses.
In the news
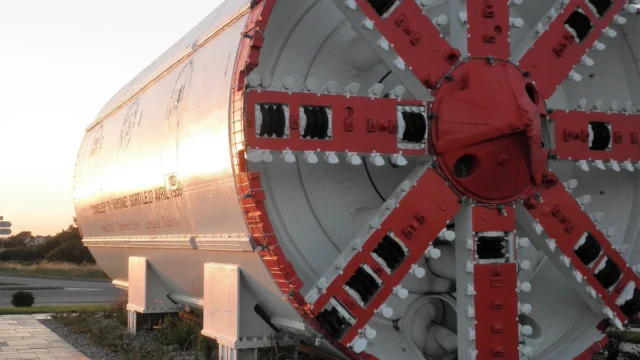
China to impose export controls on tunnel boring machines from 18 November: what it means for India
On 19 October 2026 China’s Commerce Ministry announced export controls on tunnel boring machines (TBMs) and related items from 18 November, calling them clearly dual-use. India imports TBMs for metro, rail and border tunnels and has faced customs delays on Chinese machines since 2024. China also announced controls on some drones.
19 Oct 2026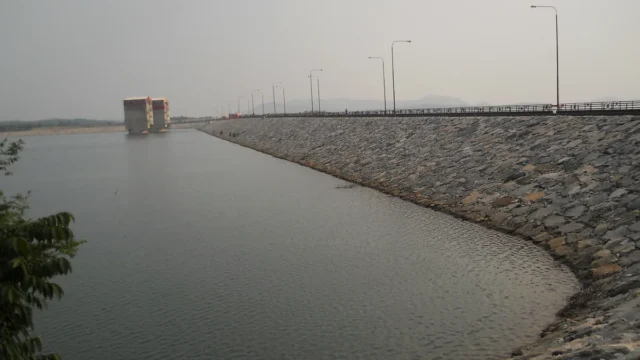
Pumped storage hydropower: India’s roadmap for 100 GW of ‘water batteries’ by 2035-36
A PIB backgrounder of 19 October 2026 explains how pumped storage projects (PSPs) will store solar and wind power for India’s grid. India runs 7.43 GW of pumped storage today, is building 15.87 GW more and has an assessed potential of 345.38 GW. A roadmap aims to add about 100 GW between 2025-26 and 2035-36.
19 Oct 2026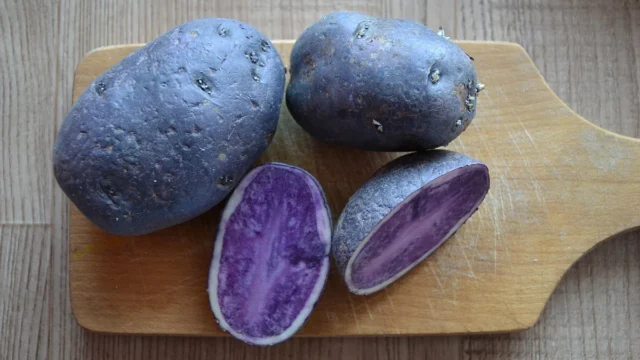
Kufri Jamunia: ICAR-CPRI’s purple potato to fight hidden hunger
A PIB backgrounder of 18 October 2026 puts the spotlight on Kufri Jamunia, a purple-fleshed potato bred by ICAR’s Central Potato Research Institute and released in 2024. It has nearly twice the Vitamin C of a common potato and several times more zinc and iron, along with antioxidants called anthocyanins. The idea is clever: instead of asking people to change what they eat, make the food they already eat more nutritious. That is biofortification.
18 Oct 2026
Oil companies bar sugar-based ethanol for 2026-27; maize incentive cut to ₹2.79 a litre
The oil marketing companies have kept sugar out of India’s ethanol programme for the coming year. The tender issued on 16 October 2026 seeks about 11 billion litres of ethanol for the 2026-27 supply year, but asks for none made from sugarcane juice, sugar syrup or B-heavy molasses, because the Government wants sugar diversion for ethanol cut to zero. Grain must now carry the load, and even the maize incentive has been cut. Read this as a live example of the food-versus-fuel trade-off.
18 Oct 2026