
CSAT (Paper II): previous-year questions
1280 real UPSC Prelims questions (2011–2026) with the official answer and a clear explanation. 400 of them came in the last five papers.
How often UPSC asks this
Questions per year, counted from the official papers.
Subtopics
Arrangements, ranking, ordering and puzzles
142 questions
Clocks and calendars
5 questions
Coding-decoding, series, patterns, cubes, dice and visual reasoning
110 questions
Communication, interpersonal skills and decision-making
10 questions
Counting, permutations, combinations and probability
1 questions
Directions, blood relations and Venn diagrams
60 questions
General English: grammar, vocabulary and comprehension
20 questions
General Hindi: grammar, vocabulary, dialects and comprehension
25 questions
Geometry and mensuration
26 questions
Number system and basic algebra (divisibility, HCF/LCM, remainders, digits, equations)
196 questions
Percentages, profit and loss, discount, simple and compound interest
47 questions
Ratio, proportion, averages, mixtures and alligation
47 questions
Syllogisms, statements and conclusions, assumptions and arguments
89 questions
Time and work; pipes and cisterns
2 questions
Time, speed and distance; trains, boats and streams; races
48 questions
Attempt the questions
Newest papers first. Tap an option; the answer and the reason appear instantly.

Directions for the following 3 (three) items : The following three items are based on the graph given below which shows imports of three different types of steel over a period of six months of a year. Study the graph and answer the three items that follow.
The figures in the brackets indicate the average cost per ton over six months period.
By how much (measured in thousands of tons) did the import of sheet steel exceed the import of coil steel in the first three months of the year?
Answer (c) & explanation
Sheet steel imports exceeded coil steel by 19 thousand tons (c). Step 1: read the graph for January to March. Sheet steel: 40 + 37 + 36 = 113 thousand tons. Step 2: coil steel for the same months: 30 + 31 + 33 = 94 thousand tons. Step 3: difference = 113 − 94 = 19 thousand tons. Options (a) 11, (b) 15 and (d) 23 come from misreading one month's bar or adding the wrong months.
Tip: in graph questions, write down each value you read before adding. Check the question's period carefully; "first three months" means January, February and March only. Read each point against the gridline to avoid small errors.
Answer as per the official UPSC answer key.
A, B, C and D are students. They are studying in four different cities, viz., P, Q, R and S (not necessarily in that order). They are studying in Science college, Arts college, Commerce college and Engineering college (not necessarily in that order), which are situated in four different States, viz., Gujarat, Rajasthan, Assam and Kerala (not necessarily in that order). Further, it is given that— (i) D is studying in Assam; (ii) Arts college is located in city S which is in Rajasthan; (iii) A is studying in Commerce college; (iv) B is studying in city Q; (v) Science college is located in Kerala.
A is studying in
Answer (b) & explanation
A studies in Gujarat (b). Step 1: D is in Assam. D cannot be in Arts (Rajasthan) or Science (Kerala). A is in Commerce. So D is in Engineering, in Assam. Step 2: B is in city Q, not city S, so B is not in Arts (city S). So B is in Science (Kerala, city Q), and C is in Arts (Rajasthan, city S). Step 3: Commerce is left with the last state, Gujarat. So A studies in Gujarat. Option (a), Rajasthan, is C's. Option (c), city Q, is B's. Option (d), Kerala, is B's.
Tip: fill the most fixed facts first, then use "cannot be" clues. A four-column table (student, city, college, state) keeps everything in view.
Answer as per the official UPSC answer key.
(Same table as the question above.)
With reference to the above table, the following assumptions have been made :
- 1. Nowadays, prosperity of an already high performing State cannot be sustained without making further large investments in its telecom infrastructure.
- 2. Nowadays, a very high Tele-density is the most essential condition for promoting the business and economic growth in a State.
Which of the above assumptions is/are valid?
Answer (d) & explanation
Neither assumption is valid (d). Step 1: the table shows data for one year only. It says nothing about what a state needs to keep its prosperity going in future. So assumption 1, about further large investments in telecom, cannot be drawn. Step 2: assumption 2 calls very high tele-density the most essential condition for growth. But state 4 grows fast with a very low tele-density. So 2 fails. Step 3: so options (a), (b) and (c) fail.
Tip: a one-year table cannot support claims about the future. And words like "most essential" need strong proof, which a single table rarely gives. Look for a data point that breaks the claim.
Answer as per the official UPSC answer key.
If RAMON is written as 12345 and DINESH as 675849, then HAMAM will be written as
Answer (b) & explanation
HAMAM is written as 92323 (b). Step 1: from RAMON = 12345: R = 1, A = 2, M = 3, O = 4, N = 5. Step 2: from DINESH = 675849: D = 6, I = 7, N = 5, E = 8, S = 4, H = 9. Step 3: HAMAM = H A M A M = 9 2 3 2 3 = 92323. Option (a), 92233, mixes up the order. Options (c) and (d) begin with 93, which would make A = 3.
Tip: in letter-to-digit codes, make a small key of each letter and its digit. Then write the new word one letter at a time. Keep the letter order exactly; that is where most slips happen.
Answer as per the official UPSC answer key.
Read the passage
India’s educational system is modelled on the mass education system that developed in the 19th century in Europe and later spread around the world. The goal of the system is to condition children as ‘good’ citizens and productive workers. This suited the industrial age that needed the constant supply of a compliant workforce with a narrow set of capabilities. Our educational institutes resemble factories with bells, uniforms and batch-processing of learners, designed to get learners to conform. But, from an economic point of view, the environment today is very different. It is a complex, volatile and globally interconnected world.
With reference to the above passage, the following assumptions have been made :
- 1. India continues to be a developing country essentially due to its faulty education system.
- 2. Today’s learners need to acquire new-age skill-sets.
- 3. A good number of Indians go to some developed countries for education because the educational systems there are a perfect reflection of the societies in which they function.
Which of the above assumptions is/are valid?
Answer (b) & explanation
Only assumption 2 is valid (b). Step 1: the passage says the old factory model of schooling was built for "a narrow set of capabilities". It does not suit today's "complex, volatile" world. So learners need new-age skills. Assumption 2 holds. Step 2: assumption 1 says India is still developing essentially due to its faulty education. The passage never makes education the main cause of underdevelopment, so 1 overstates. Step 3: assumption 3 is about Indians studying abroad. The passage does not discuss this at all. So options (a), (c) and (d) fail.
Tip: words like "essentially due to" turn a link into a single cause. Unless the passage says so, treat such statements as invalid.
Answer as per the official UPSC answer key.
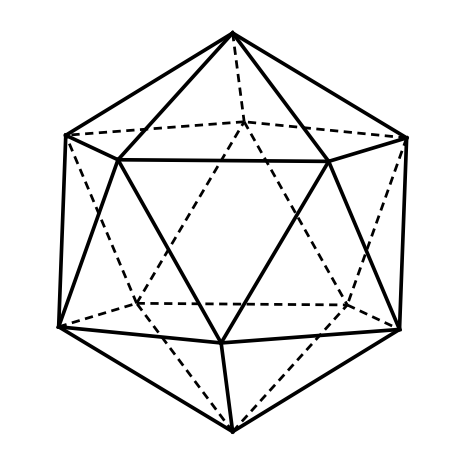
Consider the following three-dimensional figure :
How many triangles does the above figure have?
Answer (b) & explanation
The figure has 20 triangles (b). Step 1: the solid is made only of triangle faces, and 5 triangles meet at every corner. That shape is an icosahedron, a 20-faced solid. Step 2: count in layers. There are 5 triangles around the top point and 5 around the bottom point. Step 3: the middle band has 10 triangles, 5 pointing up and 5 pointing down. Total = 5 + 5 + 10 = 20. Options (a) 18, (c) 22 and (d) 24 come from missing or double-counting a layer.
Tip: count solid figures in layers, top, middle and bottom, so you neither miss nor repeat a face. Euler's rule, faces + corners − edges = 2, gives a quick check: 20 + 12 − 30 = 2.
Count the faces of the solid; the dotted lines are the hidden back edges, not extra lines.
Answer as per the official UPSC answer key.
Read the passage
Some people believe that leadership is a quality which you have at birth or not at all. This theory is false, for the art of leadership can be acquired and can indeed be taught. This discovery is made in time of war and the results achieved can surprise even the instructors. Faced with the alternatives of going left or right, every soldier soon grasps that a prompt decision either way is better than an endless discussion. A firm choice of direction has an even chance of being right while to do nothing will be almost certainly wrong.
The author of the passage holds the view that
Answer (b) & explanation
The author holds that leadership can be acquired and taught (b). Step 1: the passage says "the art of leadership can be acquired and can indeed be taught". That is option (b). Step 2: option (a) says leadership can be taught through war experience only. War is where this was discovered, not the only way. Step 3: option (d) says very few leaders come out of training. That contradicts the passage's surprising results: more leaders emerged than expected. Option (c) twists those results into a claim the passage does not make.
Tip: when the passage states the author's view in one sentence, match the option to it. Reject options that add "only" or reverse the findings.
Answer as per the official UPSC answer key.
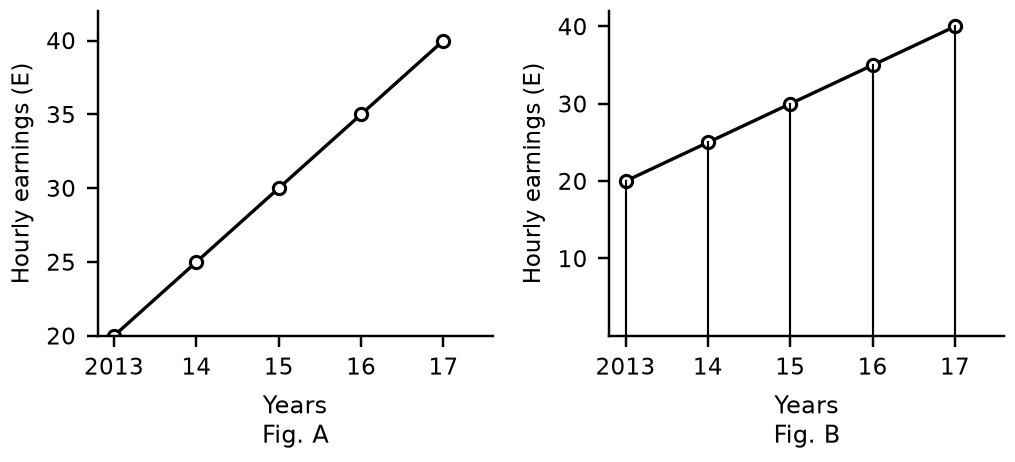
Average hourly earnings per year (E) of the workers in a firm are represented in figures A and B as follows :
From the figures, it is observed that the
Answer (c) & explanation
The slopes of the two graphs are the same (c). Step 1: read the points. Both figures show earnings of 20, 25, 30, 35 and 40 for 2013 to 2017. Step 2: only the scale of the side axis differs. That makes one line look steeper than the other, but the data are the same. Step 3: so the values (a), the range of 20 (b) and the rise of 5 per year (d) are identical in both. The slope, the rise per year, is the same. So (a), (b) and (d) are all wrong.
Tip: always read the numbers on the axes, not the look of the line. Changing the scale is a common trick to make growth look faster or slower.
Do not judge steepness by eye when the two axes are drawn to different scales.
Answer as per the official UPSC answer key.
(Same graph as the question above.)
What was the approximate total value (in $) of sheet steel imported over the six months period?
Answer (c) & explanation
The total value is about 55,550 (c). Step 1: add sheet steel imports over all six months: 40 + 37 + 36 + 36 + 34 + 34 = 217 thousand tons. Step 2: the bracket gives the average cost as 256 per ton. Step 3: value = 217 × 256 = 55,552, which is about 55,550 (in thousands of dollars). Option (a), 45,555, option (b), 50,555, and option (d), 65,750, come from wrong totals or a wrong cost figure.
Tip: when an average cost is given for the whole period, multiply it by the total quantity. You do not need month-by-month costs. Round only at the end to keep the answer close.
Use the sheet price ($ 256), not the coil or scrap price.
Answer as per the official UPSC answer key.
(Same information as the question above.)
Science college is located in
Answer (a) & explanation
The Science college is in city Q (a). Step 1: from the full solution, B studies in the Science college. Step 2: B studies in city Q (clue iv). Step 3: so the Science college is in city Q, which is in Kerala. Option (b), city S, has the Arts college. Options (c) city R and (d) city P are left for A (Commerce) and D (Engineering).
Tip: once a grid puzzle is solved, answer linked questions straight from your table. Here one line, "B: Science, city Q, Kerala", answers the question at once. Keep the table neat so each later question takes seconds.
Answer as per the official UPSC answer key.
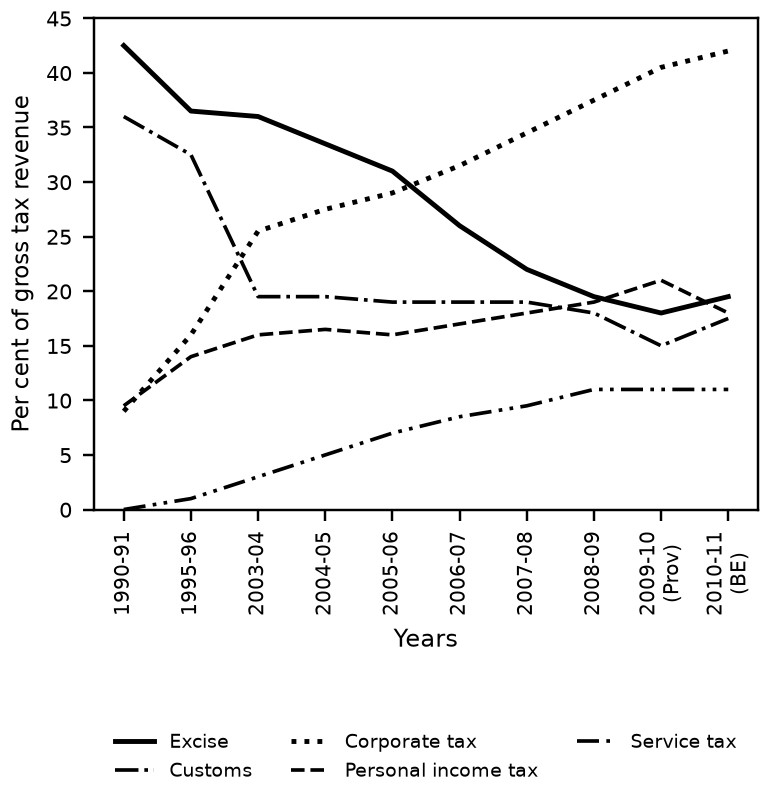
The following graph indicates the composition of our tax revenue for a period of two decades :
With reference to the above graph, which of the following is/are the most logical and rational inference/inferences that can be made?
- 1. During the given period, the revenue from Direct Taxes as percentage of gross tax revenue has increased while that of Indirect Taxes decreased.
- 2. The trend in the revenue from Excise Duty demonstrates that the growth of manufacturing sector has been negative during the given period.
Select the correct answer using the code given below.
Answer (a) & explanation
Only inference 1 is right (a). Step 1: in the graph, direct taxes (corporate tax and personal income tax) rise. Corporate tax goes from about 9% to about 42% of the total. Indirect taxes (excise and customs) fall. So 1 is correct. Step 2: statement 2 says the fall in excise shows negative manufacturing growth. But the graph shows excise as a share of total tax, not the size of manufacturing. A share can fall even when manufacturing grows, if other taxes grow faster. So 2 is wrong. Step 3: options (b), (c) and (d) fail.
Tip: a falling share is not a falling amount. Today, excise on most goods has been folded into GST, introduced in 2017.
Answer as per the official UPSC answer key.
If X is between –3 and –1, and Y is between –1 and 1, then X2 – Y2 is in between which of the following?
Answer (d) & explanation
X² − Y² lies between 0 and 9 (d). Step 1: squaring removes the minus sign. X is between −3 and −1, so X² is between 1 and 9. Y is between −1 and 1, so Y² is between 0 and 1. Step 2: the largest value of X² − Y² is just under 9 − 0 = 9. Step 3: the smallest is just over 1 − 1 = 0. So the answer is between 0 and 9. Option (a), −9 and 1, and option (b), −9 and −1, forget that squares are never negative. Option (c), 0 and 8, gets the upper end wrong.
Tip: for the range of a difference, make the first part as big as possible and the second as small, then the reverse.
multiplying the end points without squaring first gives the negative options.
Answer as per the official UPSC answer key.
Read the passage
The practice of dieting has become an epidemic; everyone is looking out for a way to attain that perfect body. We are all different with respect to our ethnicity, genetics, family history, gender, age, physical and mental and spiritual health status, lifestyles and preferences. Thereby we also differ in what foods we tolerate or are sensitive to. So we really cannot reduce so many complexities into one diet or diet book. This explains the failure of diets across the world in curbing obesity. Unless the reasons for weight gain are well understood and addressed and unless habits are changed permanently, no diet is likely to succeed.
What is the most logical and rational inference that can be made from the above passage?
Answer (d) & explanation
The inference is that there is no perfect diet or single solution for obesity (d). Step 1: the passage says "we really cannot reduce so many complexities into one diet". So no one diet fits all. That is (d). Step 2: option (a) says obesity is a worldwide epidemic. But the passage calls dieting the epidemic, so (a) misreads it. Step 3: option (b), people obsessed with a perfect body, just repeats the opening line; it is not the inference drawn. Option (c), obesity is incurable, is never said.
Tip: an inference is the conclusion the author reaches, usually near the end. Opening lines often set the scene and make tempting but wrong answers.
Answer as per the official UPSC answer key.
Consider the following sum :
• + 1• + 2• + •3 + •1 = 21•
In the above sum, • stands for
Answer (d) & explanation
1. Test the options by putting the digit in place of •.
2. Try 8: 8 + 18 + 28 + 83 + 81 = 218. The answer has the form 21• with • = 8. Works.
3. Try 4: 4 + 14 + 24 + 43 + 41 = 126, not 214. Try 5: 5 + 15 + 25 + 53 + 51 = 149. Try 6: 6 + 16 + 26 + 63 + 61 = 172. All fail.
4. • = 8.
Answer as per the official UPSC answer key.
A number consists of three digits of which the middle one is zero and their sum is 4. If the number formed by interchanging the first and last digits is greater than the number itself by 198, then the difference between the first and last digits is
Answer (b) & explanation
The difference between the first and last digits is 2 (b). Step 1: the number has the form a0c, with a zero in the middle. Swapping the end digits changes the number by 99 × (c − a). Step 2: the new number is 198 more, so 99(c − a) = 198, which gives c − a = 2. Step 3: check: the digits add to 4, so a + c = 4. With c − a = 2, we get a = 1 and c = 3. The number is 103, and 301 − 103 = 198. Options (a), (c) and (d) fail.
Tip: for any 3-digit number, swapping the first and last digits changes it by 99 times their difference. This saves solving long equations.
Answer as per the official UPSC answer key.
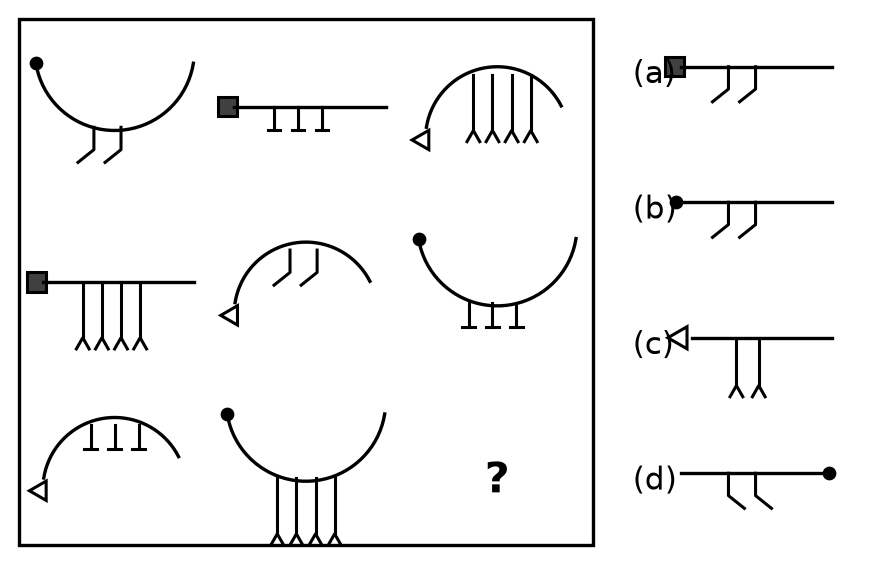
Consider the figures given below :
To fit the question mark, the correct answer is
Answer (a) & explanation
Figure (a) fits the question mark (a). Step 1: break each figure into two parts: a top (a curve with a dot, a straight line with a black square, or a half-curve with a triangle) and legs (2 bent legs, 3 short legs, or 4 forked legs). Step 2: in each row, every top and every type of legs appears exactly once. Step 3: row 3 already has the half-curve with 3 legs and the dotted curve with 4 legs. The missing pair is the square-ended line with 2 bent legs. That is figure (a). Options (b), (c) and (d) repeat a top or legs already in the row.
Tip: in 3 × 3 figure grids, split each figure into parts and check that each part appears once per row and column.
Answer as per the official UPSC answer key.
(Same graph as the question above.)
What was the approximate ratio of sheet steel and scrap steel imports in the first three months of the year?
Answer (b) & explanation
The ratio is about 1.2 : 1 (b). Step 1: sheet steel for January to March = 113 thousand tons, as found before. Step 2: scrap steel for the same months: 32 + 34 + 32 = 98 thousand tons. Step 3: ratio = 113 ÷ 98 ≈ 1.15, which rounds to 1.2 : 1. Option (a), 1 : 1, ignores the gap. Options (c) 1.4 : 1 and (d) 1.6 : 1 are much too large.
Tip: for "approximate ratio", divide and round to the nearest option. 113 is about 15% more than 98, so the ratio is a little above 1. That alone rules out (c) and (d).
Answer as per the official UPSC answer key.
(Same information as the question above.)
C is studying in
Answer (b) & explanation
C studies in Rajasthan (b). Step 1: from the solution, C is in the Arts college. Step 2: clue (ii) says the Arts college is in city S, which is in Rajasthan. Step 3: so C studies in Rajasthan. Option (a), Science college, belongs to B. Option (c), Gujarat, is A's state. Option (d), city Q, is B's city.
Tip: one clue can link three things at once, here college, city and state. Use such clues to fill several boxes together. Clue (ii) does a lot of work in this puzzle, so look for clues like it first in similar sets.
Answer as per the official UPSC answer key.
If x – y = 8, then which of the following must be true?
- 1. Both x and y must be positive for any value of x and y.
- 2. If x is positive, y must be negative for any value of x and y.
- 3. If x is negative, y must be positive for any value of x and y.
Select the correct answer using the code given below.
Answer (d) & explanation
None of the three statements must be true (d). Step 1: statement 1 says both must be positive. But x = 2, y = −6 gives x − y = 8, with y negative. So 1 fails. Step 2: statement 2 says if x is positive, y must be negative. But x = 10, y = 2 works, with both positive. So 2 fails. Step 3: statement 3 says if x is negative, y must be positive. But y = x − 8, so if x is negative, y is even more negative. For example, x = −1, y = −9. So 3 fails too. Options (a), (b) and (c) fail.
Tip: to test "must be true", find one example that breaks it. Try a mix of positive, negative and zero values.
Answer as per the official UPSC answer key.
X and Y are natural numbers other than 1, and Y is greater than X. Which of the following represents the largest number?
Answer (a) & explanation
XY is the largest (a). Step 1: try simple numbers that fit: X = 2 and Y = 3. Then XY = 6, X/Y = 0.67, Y/X = 1.5 and (X + Y)/XY = 5/6. Step 2: XY is the biggest here. Step 3: check that it always holds. XY ÷ (Y/X) = X², and since X is more than 1, X² > 1. So XY is always bigger than Y/X. X/Y is less than 1, and (X + Y)/XY is at most 1. So options (b), (c) and (d) are smaller.
Tip: testing small numbers that obey the conditions is a quick way to pick the answer. Then a one-line check confirms it works in general.
Answer as per the official UPSC answer key.